First, have a look at How to Navigate to grasp all the capabilities of the interactive results.
Wind turbines are installed at their full potential of 8.0 GW and 9.0 GW in the OFFSHORE and INLAND clusters respectively. On top of that, 28.3 GW of solar PV is installed while the maximum potential is 50 GW.
The installed capacity of solar PV is 57% of the potential, because of a higher curtailment of additional capacity, increasing the marginal cost of production. The curtailment of wind turbines and solar PV is partly due to the constraint put on the electricity transport network (power inside the network must be lower than 23.0 GW), and the constraint that CCGTs must produce at minimum 40% of their installed capacity.
11.9 GW of dispatchable CCGTs is installed in the optimal system to complement intermittent renewable electricity production. They produce 61.3 TWh of electricity, resulting in a capacity factor of 58.8 %. They are able to follow the huge ramp-up / ramp-down requirements of intermittent renewable production (wind and sun) on the one side, and the daily profile of electricity demand on the other side, to balance the electricity system at lowest cost.
The OFFSHORE cluster is equipped with batteries (1.14 GWh, 0.13 GW of charge and 0.75 GW of discharge capacity) to smooth offshore wind production before transporting it through a 6.8 GW-interconnector with the COASTAL cluster. A 6.6 GW-interconnector brings electricity forward further to the INLAND cluster. Only 0.1 TWh of hydrogen is produced offshore, while 1.6 TWh is produced in the COASTAL cluster, all through electrolysis (no SMR capacity is installed). A 1.1-GW H2 pipeline is sufficient to transport H2 to the INLAND cluster to supply the H2 demand. Note that the electricity interconnector between the COASTAL and INLAND clusters is sometimes used in the reverse direction to bring excess solar PV produced in the INLAND cluster to the electrolysers in the COASTAL cluster for conversion into hydrogen, thus avoiding curtailment. The optimal location of electrolysers is thus in the COASTAL cluster, because it can be used as well to store excess offshore wind electricity in the winter and excess solar PV electricity in the summer.
A significant amount of batteries is installed in the COASTAL (10.36 GWh, 1.16 GW of charge and 6.98 GW of discharge capacity) and INLAND (16.25 GWh, 1.47 GW of charge and 8.81 GW of discharge capacity) clusters to smooth the solar PV production (daily profile) and help balance the electricity system. All batteries are highly used: all batteries have a full charge/discharge cycle on average every 2 days. This is their optimal use because of their high capital expenses, self-discharge rate and roundtrip efficiency.
No H2 storage, fuel cells, direct air capture or methanation capacity is installed in the OFFSHORE and COASTAL clusters.
In the optimal energy system, no additional hydro-pumped storage is installed due to its lower roundtrip efficiency compared to electrical batteries, despite a higher investment cost. No additional CH4 storage is installed because there is ample import capacity by pipeline to follow the methane demand.
Neither hydrogen nor synthetic methane are produced in the INLAND cluster and no CO2 storage is installed.
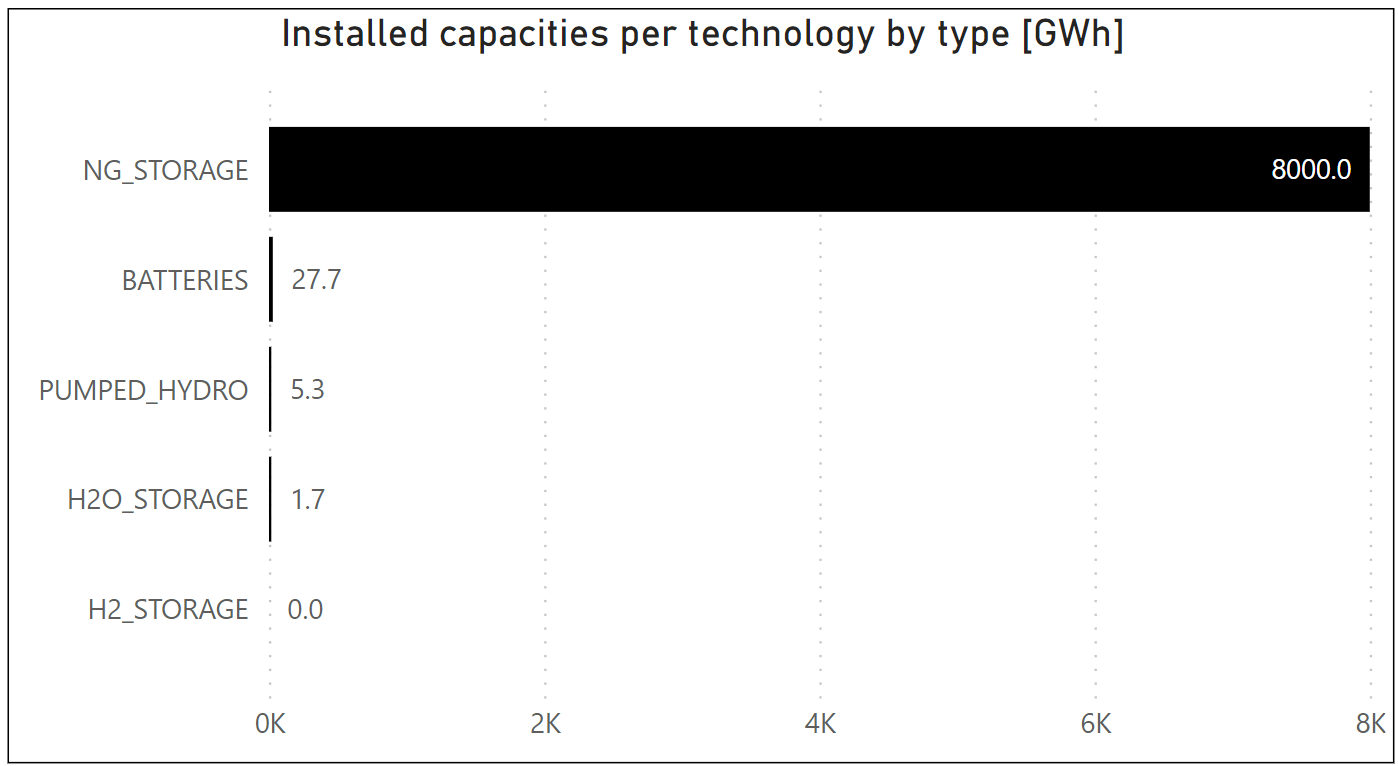
The next graph shows the storage capacities installed in the Base Case: the existing methane storage capacity is present but rarely used; 27.7 GWh of batteries is deployed and extensively used; 5.3 GWh of existing pumped-hydro capacity is present but not used. No H2 storage is built because of the high cost of H2 storage tanks.
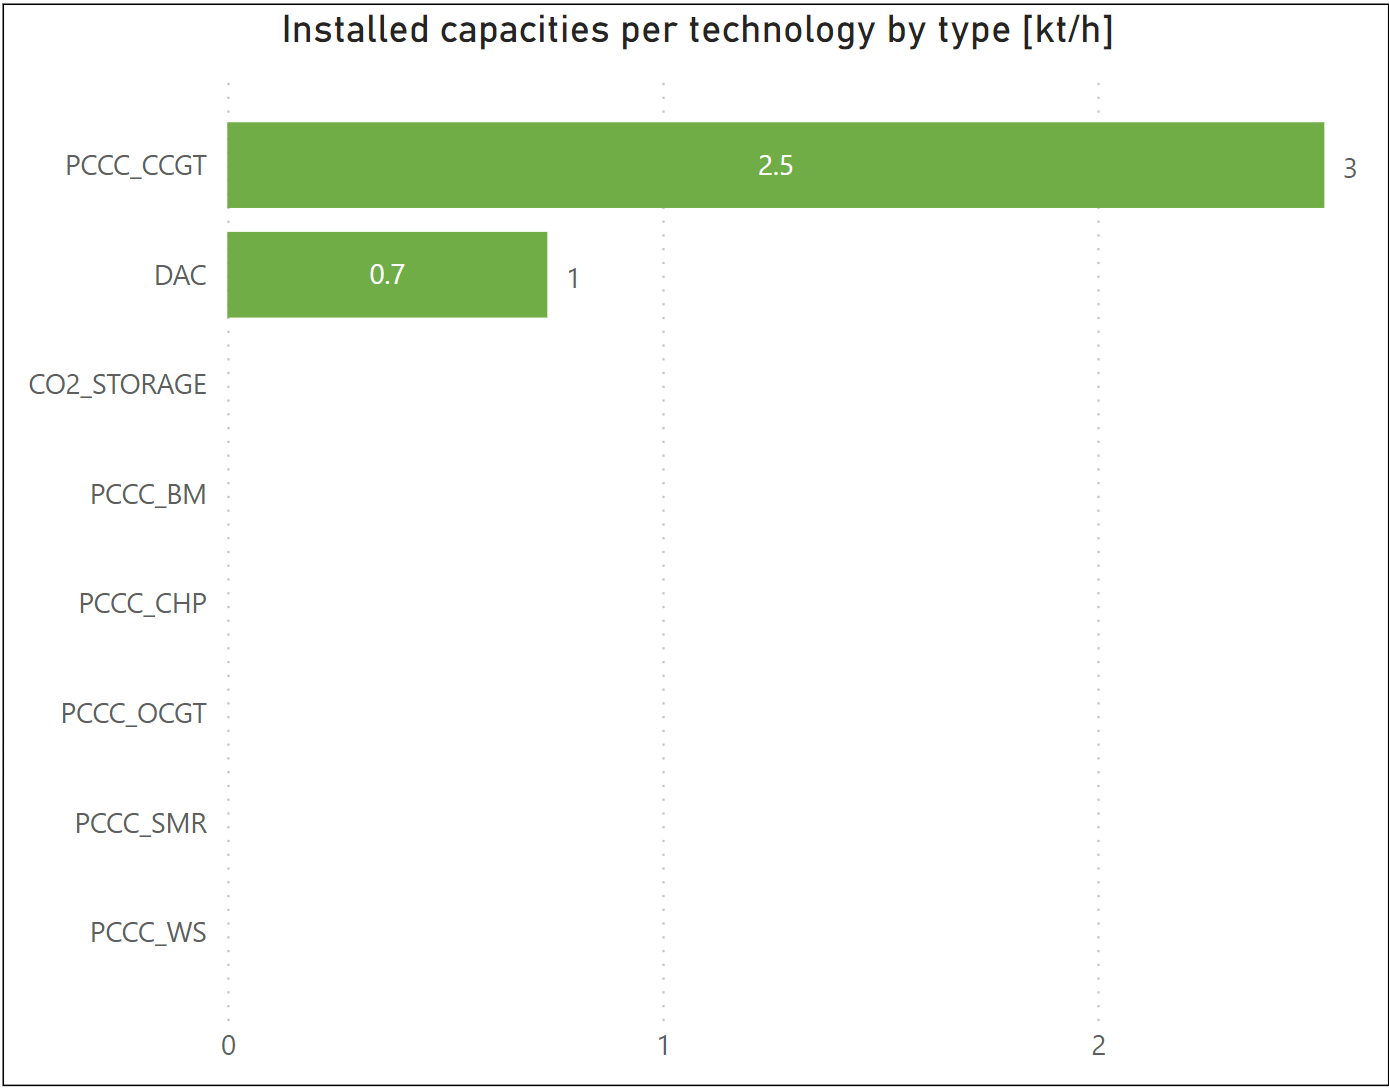
The next graph shows the capacities deployed for PCCC (only on CCGTs) and DAC in the Base Case