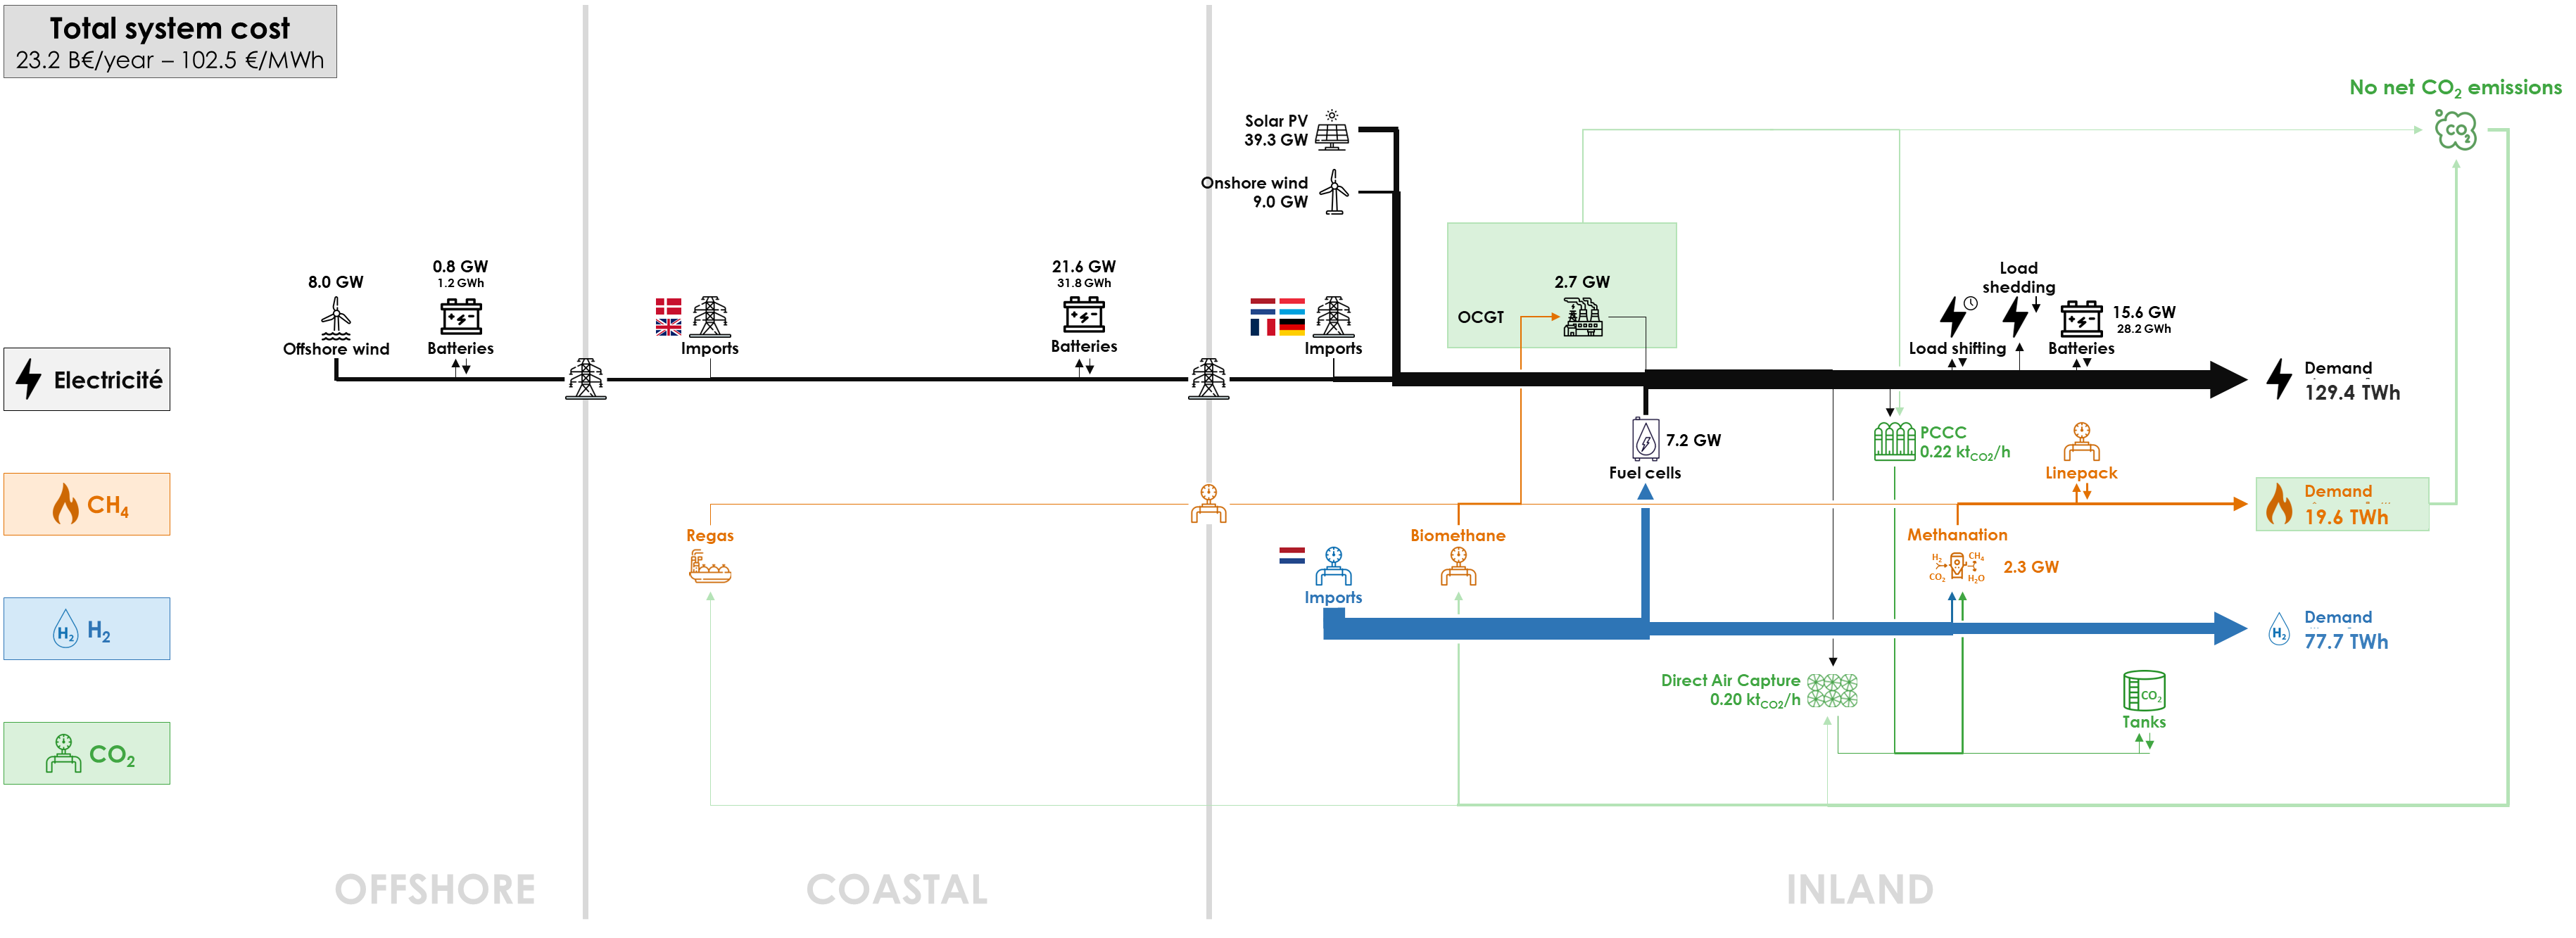
The capacity to export CO2 by pipeline strongly impacts the deployment of renewable electricity in Belgium’s net-zero energy system in 2050. When this capacity decreases, less CO2 emissions are allowed, so that CCGTs are less used and more electricity is imported. In the extreme case, no CO2 can be exported at all, CCGTs are seldom used and the captured CO2 from remaining CCGTs and DAC is even used in methanation facilities to produced CH4 needed for final demand, which is the only way of using captured CO2.
Here is the diagram with the deployed technologies and the commodity flows in the optimal energy system with a CO2 export capacity of 0 kt/h:
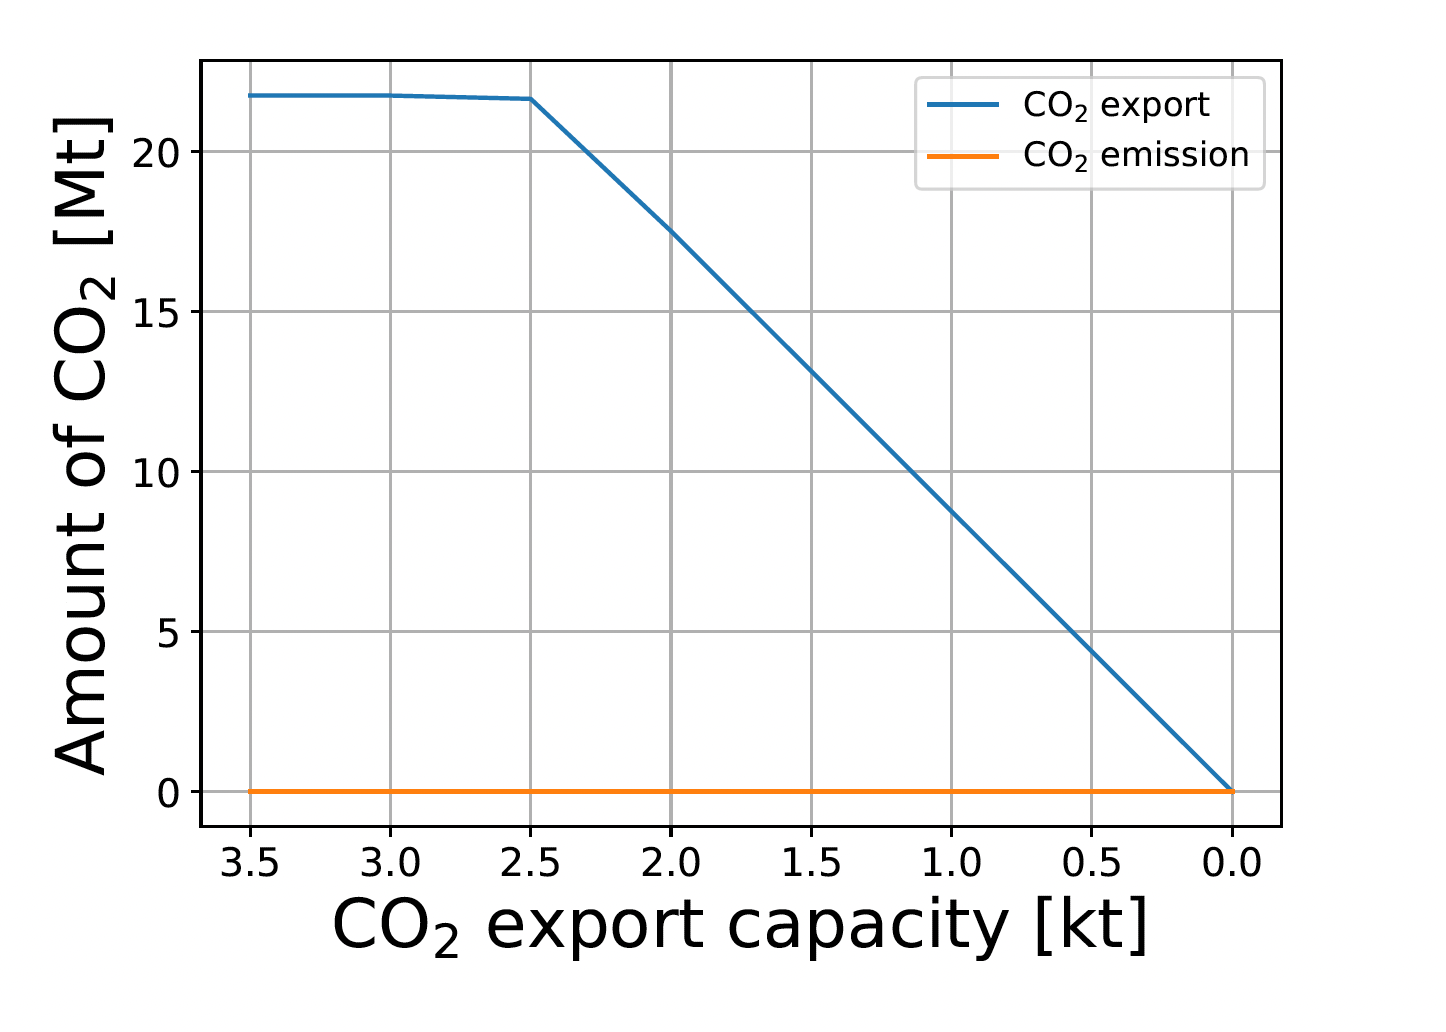
When the constraint on CO2 export capacity is reduced from 3.5 kt/h in the Base Case down to 0, the amount of exported CO2 is unchanged till 2.5 kt/h, and then decreases simultaneously with the decreasing capacity (see figure below). This showcases that this constraint is not reached in the Base Case, but that it impacts the energy system between 2.5 kt/h and 0.
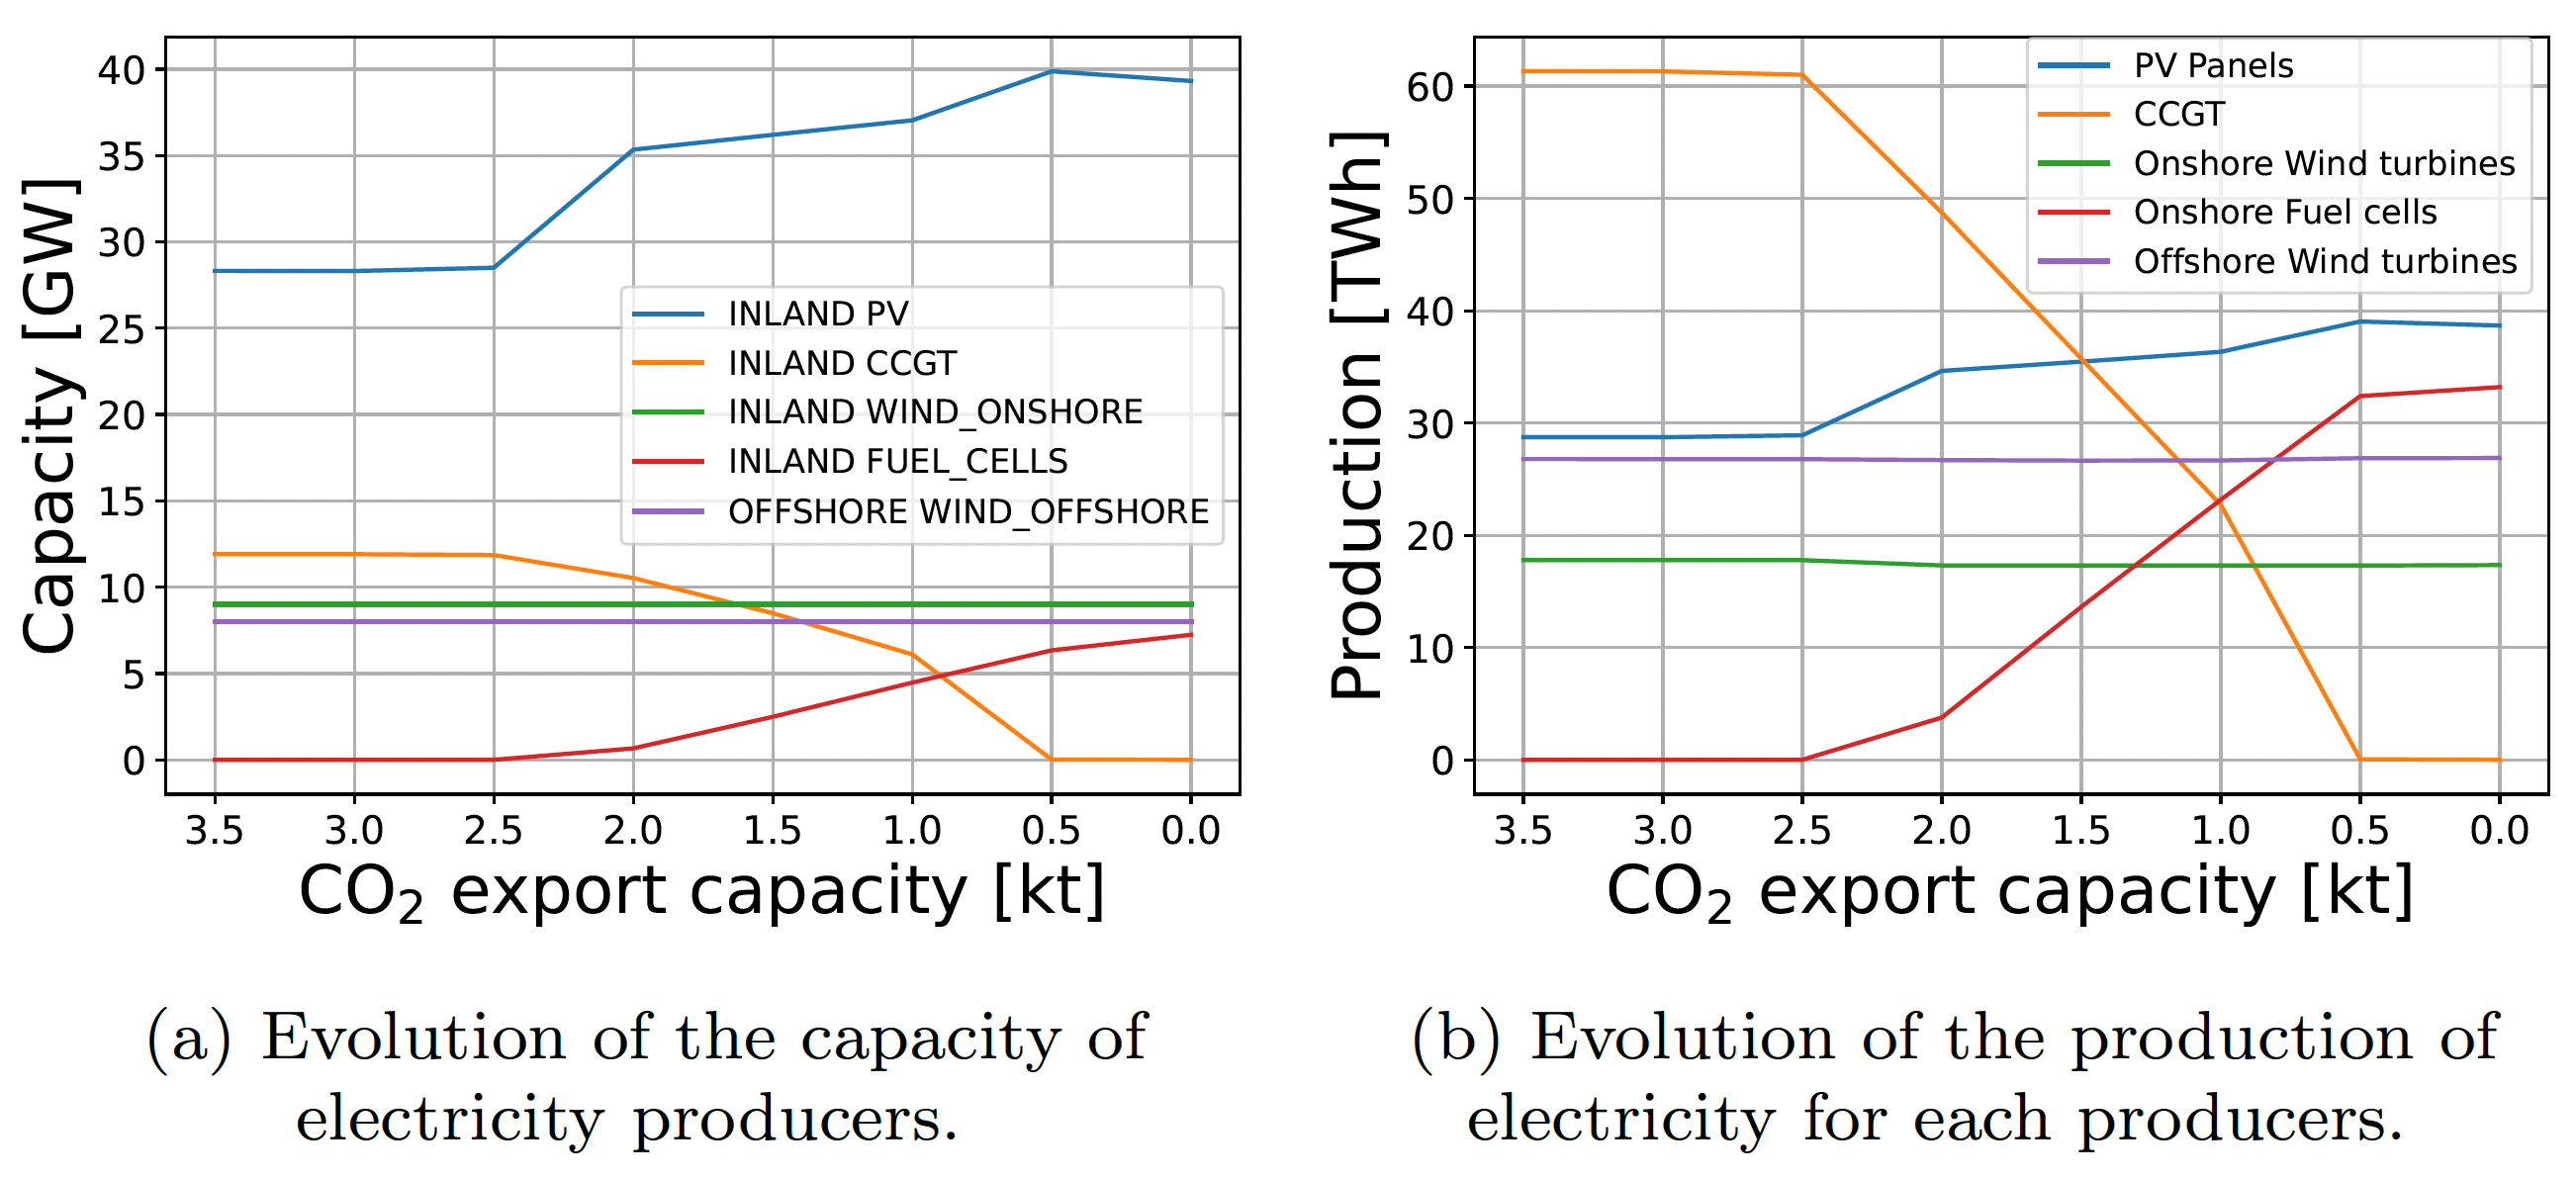
The electricity system is strongly impacted when the CO2 export capacity is reduced. In the left side of the figure below, we see that solar PV capacity increases to 39.3 GW from 28.3 GW in the Base Case. CCGT capacity is reduced to 0 when the CO2 export capacity is lower than 0.5 kt/h. Below 2.5 kt/h of CO2 export capacity, dispatchable electricity is increasingly provided by up to 7.2 GW of fuel cells at 0 kt/h of CO2 export capacity, that produce up to 33.2 TWh of electricity, while no fuel cells were installed in the Base Case.
On the right side of the figure below, we see that the production of CCGTs is strongly reduced from 61.3 GWh for a CO2 export capacity between 3.5 and 2.5 kt/h, down to 0 at 0.5 kt/h. This is compensated by a higher production of solar PV, while OCGTs appear below 1 kt/h of CO2 export capacity and fuel cells complement dispatchable electricity below a CO2 export capacity of 0.5 kt/h.
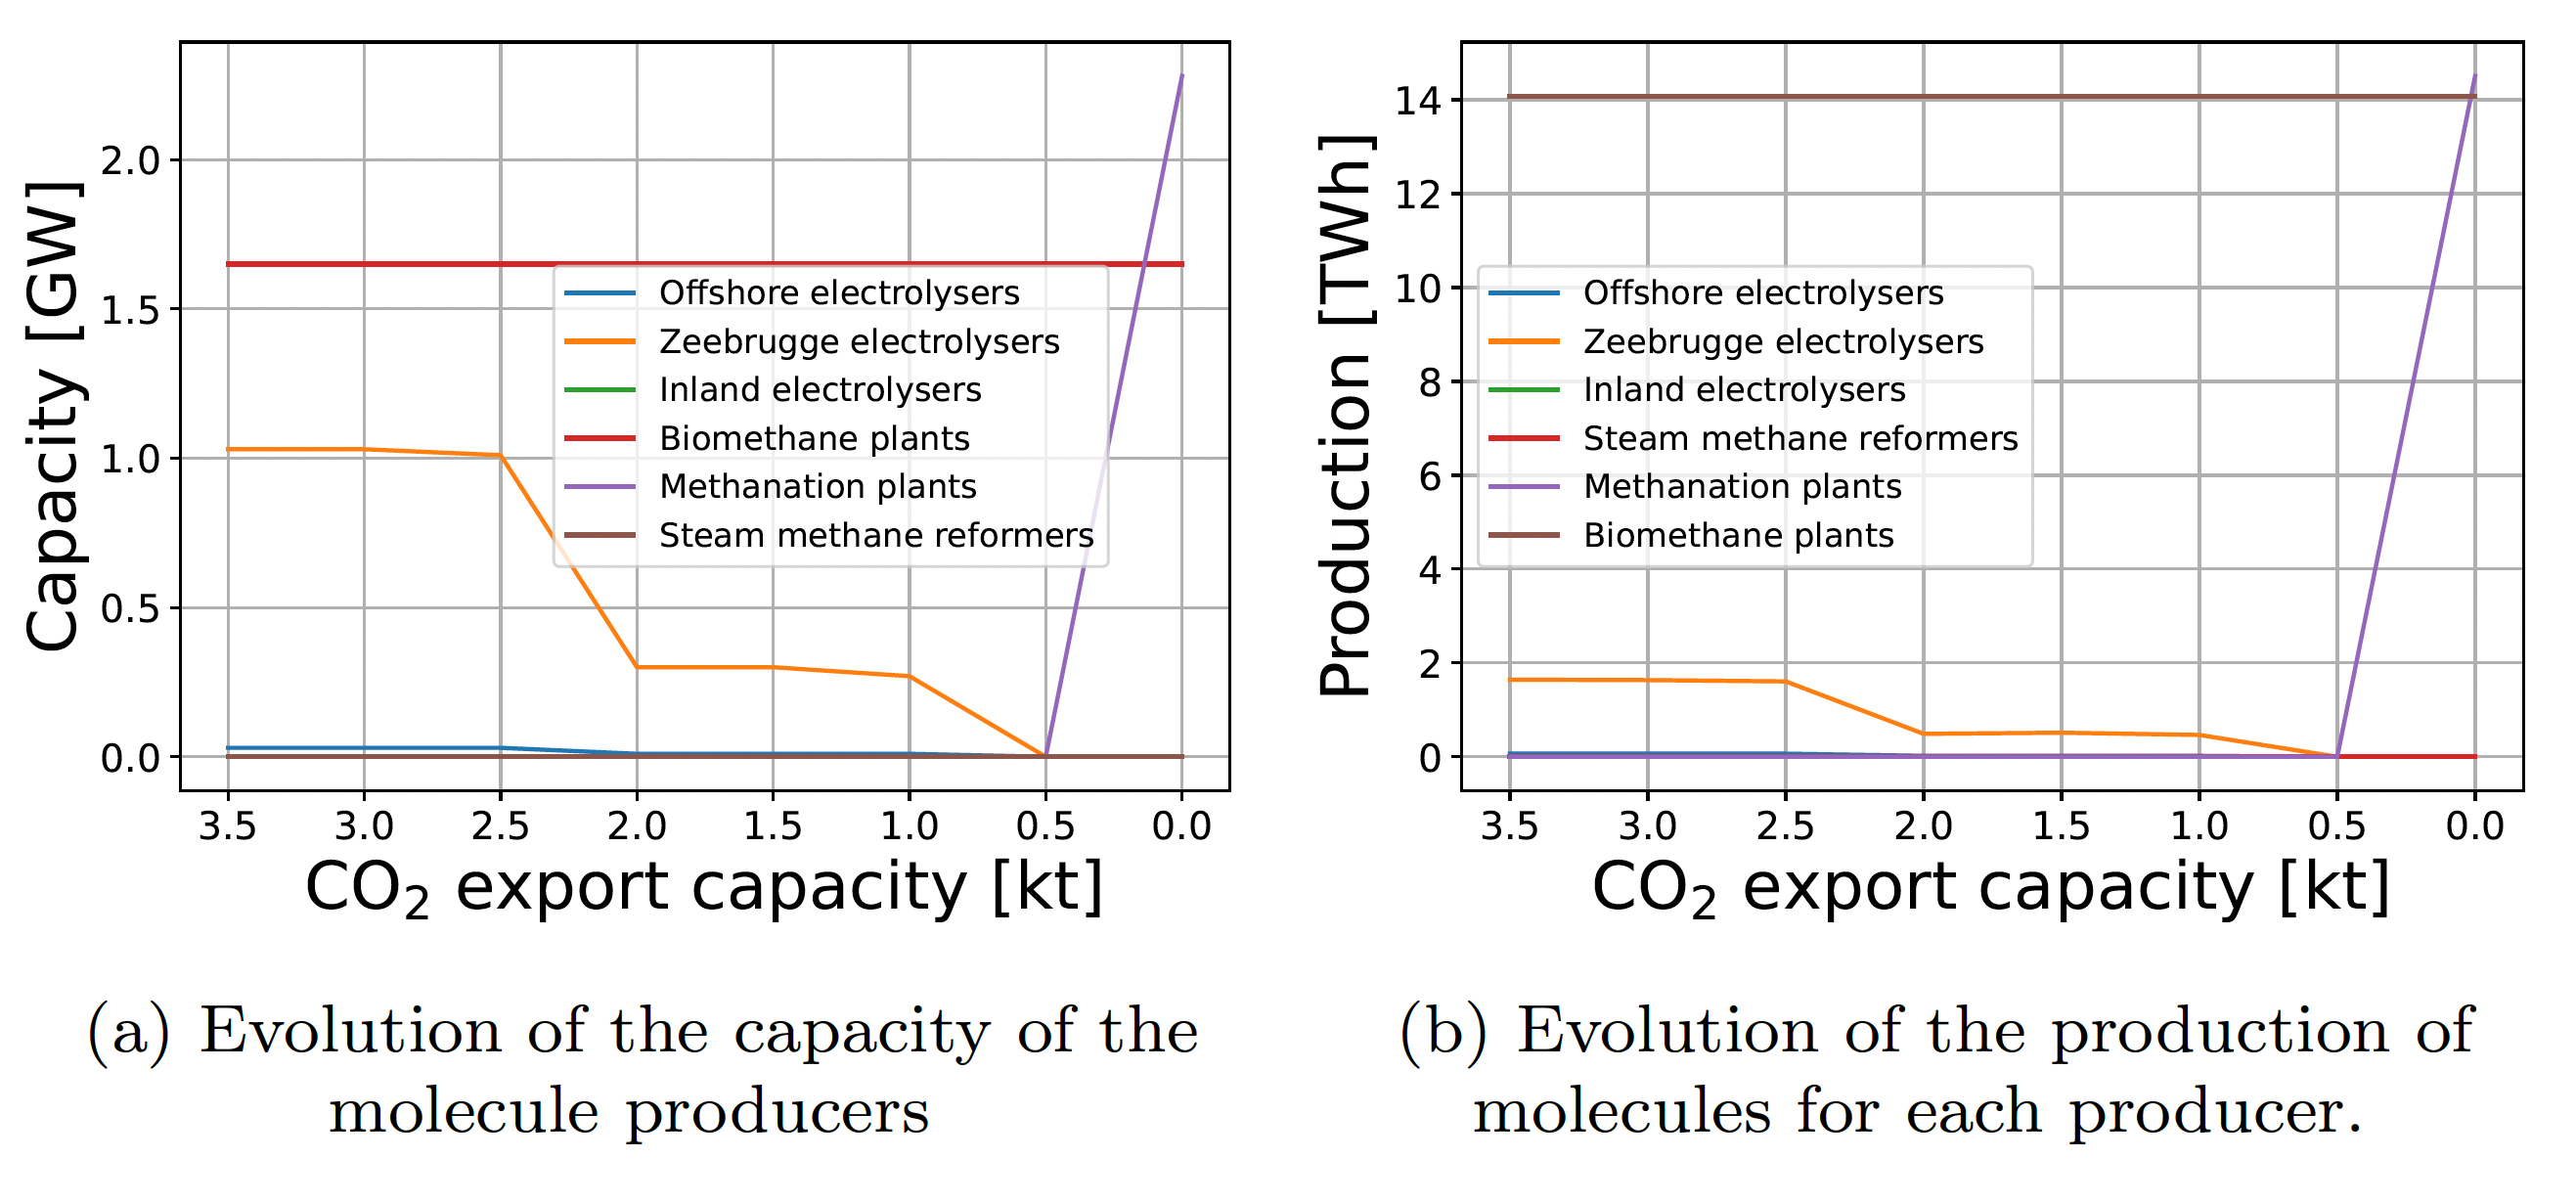
Significant changes also take place in the hydrogen and methane systems. In the left side of the figure below, we see that electrolysers are less deployed in the COASTAL cluster, because more electricity has to be used directly (through batteries) instead of from CCGTs. For a CO2 export capacity of 0.5 to 0 kt/h, we see the appearance of a strong methanation capacity of 2.3 GW that produces 14.5 TWh at 0 kt/h. Methanation supplies most of final CH4 demand instead of imports.
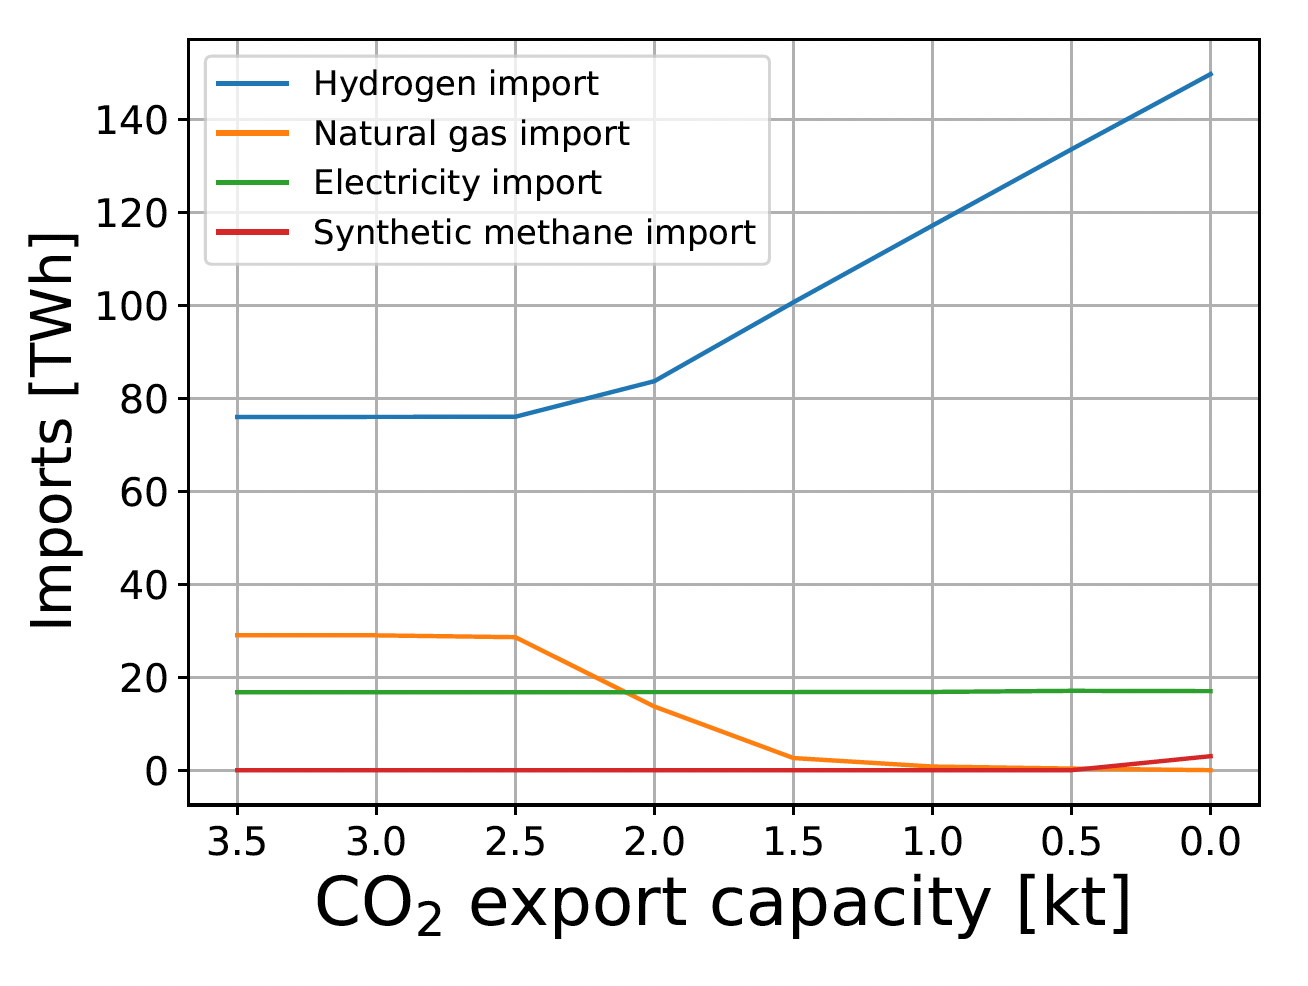
The next figure shows that electricity imports remain stable when the CO2 export capacity is reduced from 3.5 kt/h to 0, while methane imports are reduced from 107.8 TWh to 0 quite linearly from 2.5 kt/h to 0 kt/h because less and less CO2 emissions could be exported. The whole energy system then relies on increasing imports of hydrogen – cheaper than imported synthetic methane – that is used directly or converted to electricity through fuel cells. Hydrogen imports double to 149.7 TWh with no CO2 export capacity from 76.0 TWh in the Base Case.
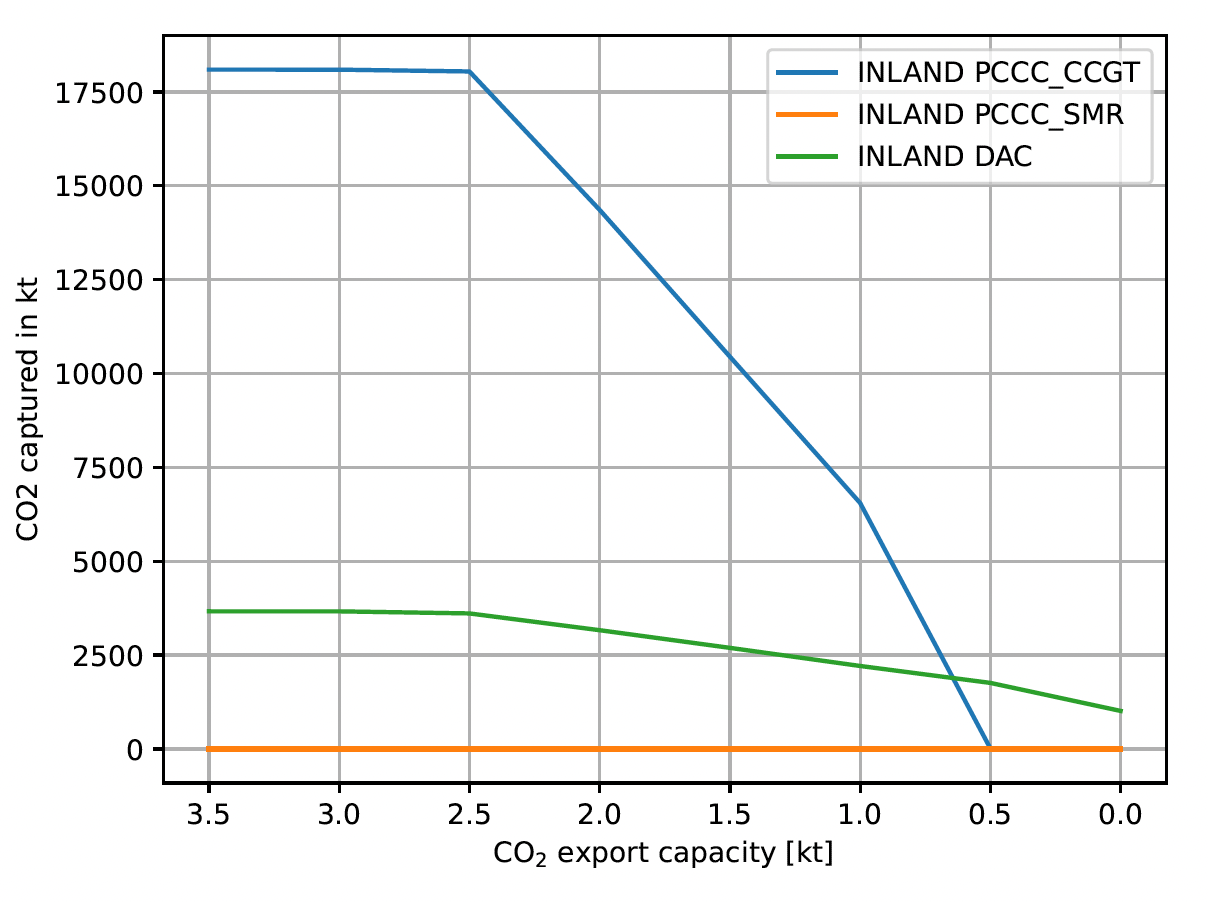
As the CO2 export capacity is reduced, and less CCGTs are deployed, PCCC decrease as well. The figure below shows that CO2 captured from CCGTs decreases to 0 for a CO2 export capacity of 0-0.5 kt/h from 18.1 MtCO2 in the Base Case.
These drastic changes in the energy system as the CO2 export capacity decreases from 3.5 kt/h to 0 kt/h lead to an increase of the total energy cost by about 12%: from €20.7 billion per year at 3.5 kt/h to €23.2 billion at 0 kt/h.
All results can be visualised in the Interactive Results section by selecting a “CO2 Export Capacity” scenario with the specified CO2 export capacity in kt/h.